I recently read Annekatrien Debien’s post on Digital Geography regarding extracting information from Sentinel-1, specifically ship data and I decided to follow the tutorial for an area of the South-West coast of Ireland.
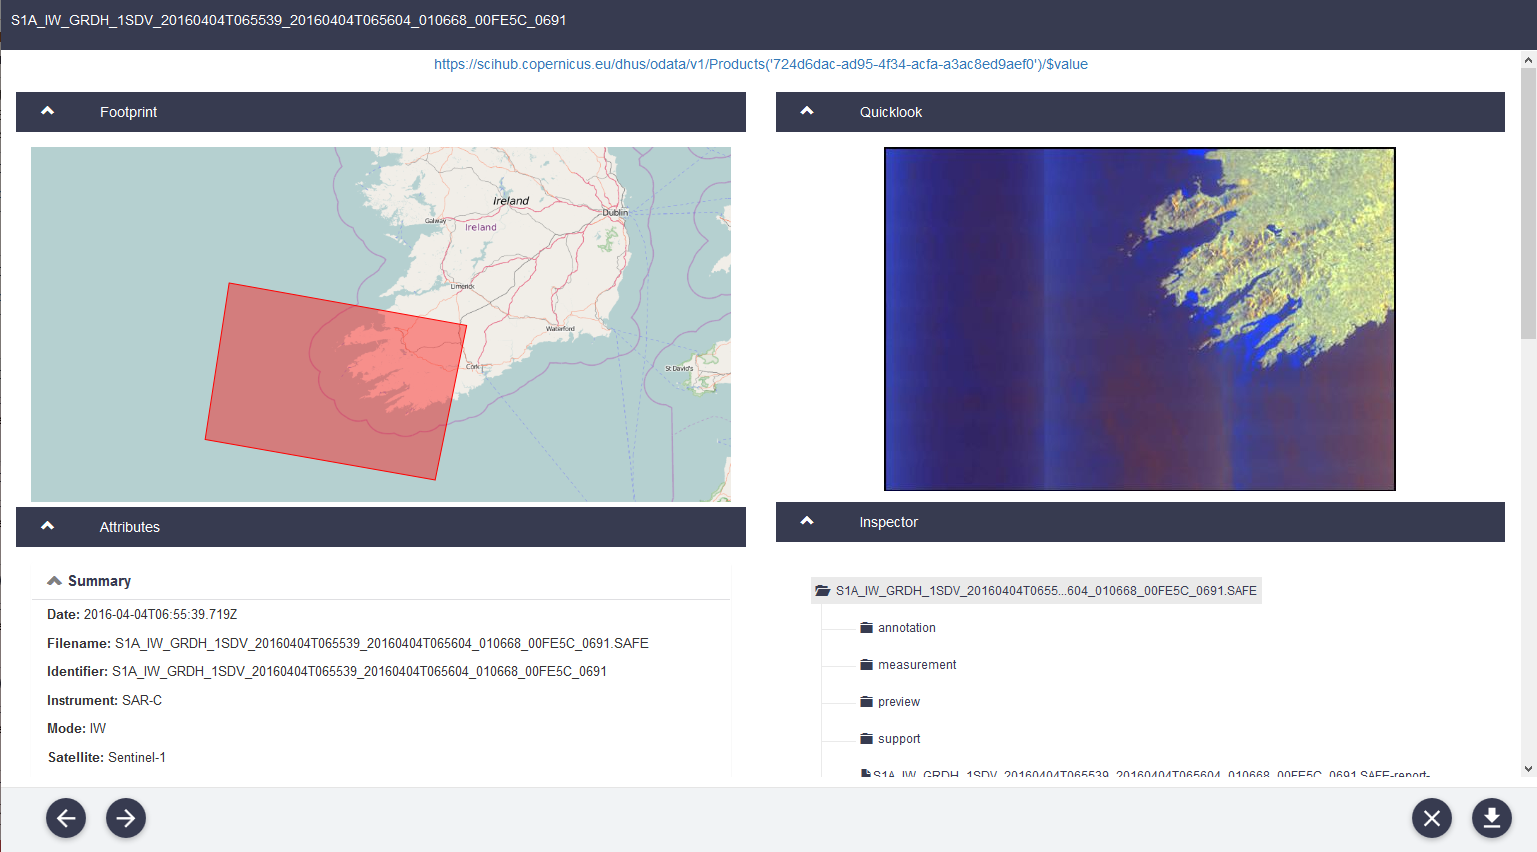
The first step was to download a Sentinel-1 image from the Copernicus website. I downloaded an image captured on the 4th April 2016.
The next step was to open the image in the SNAP toolbox. Once it was opened, the next step was to calibrate the image. You have to go to Radar –> Radiometric –> Calibrate as shown below.
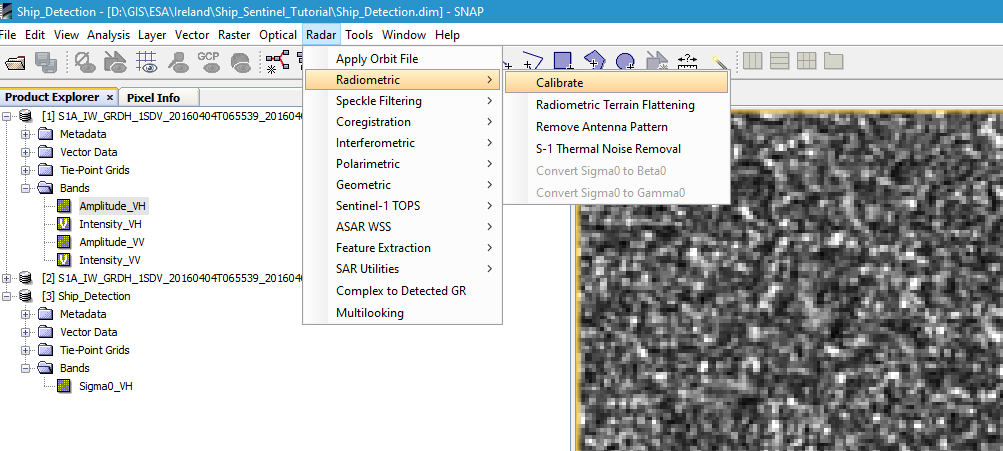
To calibrate you have to select both bands VH and VV on the second tab that is displayed after you click calibrate and the parameter you need it Sigma0.
Once the calibration has run then a second product appears in the window.
Extracting Information on Ships:
The next step was to extract information on the ships. The option is located at:
Go to Radar –> Feature Extraction –> Ocean Tools –> Ocean Object Detection
You have to make sure that the calibrated image is the one selected as shown.
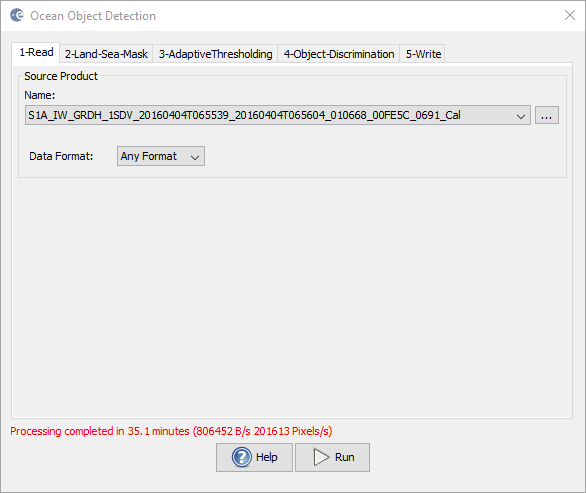
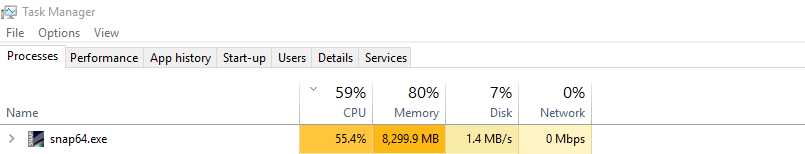
The Sigma0_VH is the band to select. You then click run. It is quite memory and CPU intensive and took my computer 35 minutes to complete (it’s only a few months old with a lot of RAM so that may have helped). It is a very intensive process as you can see below.
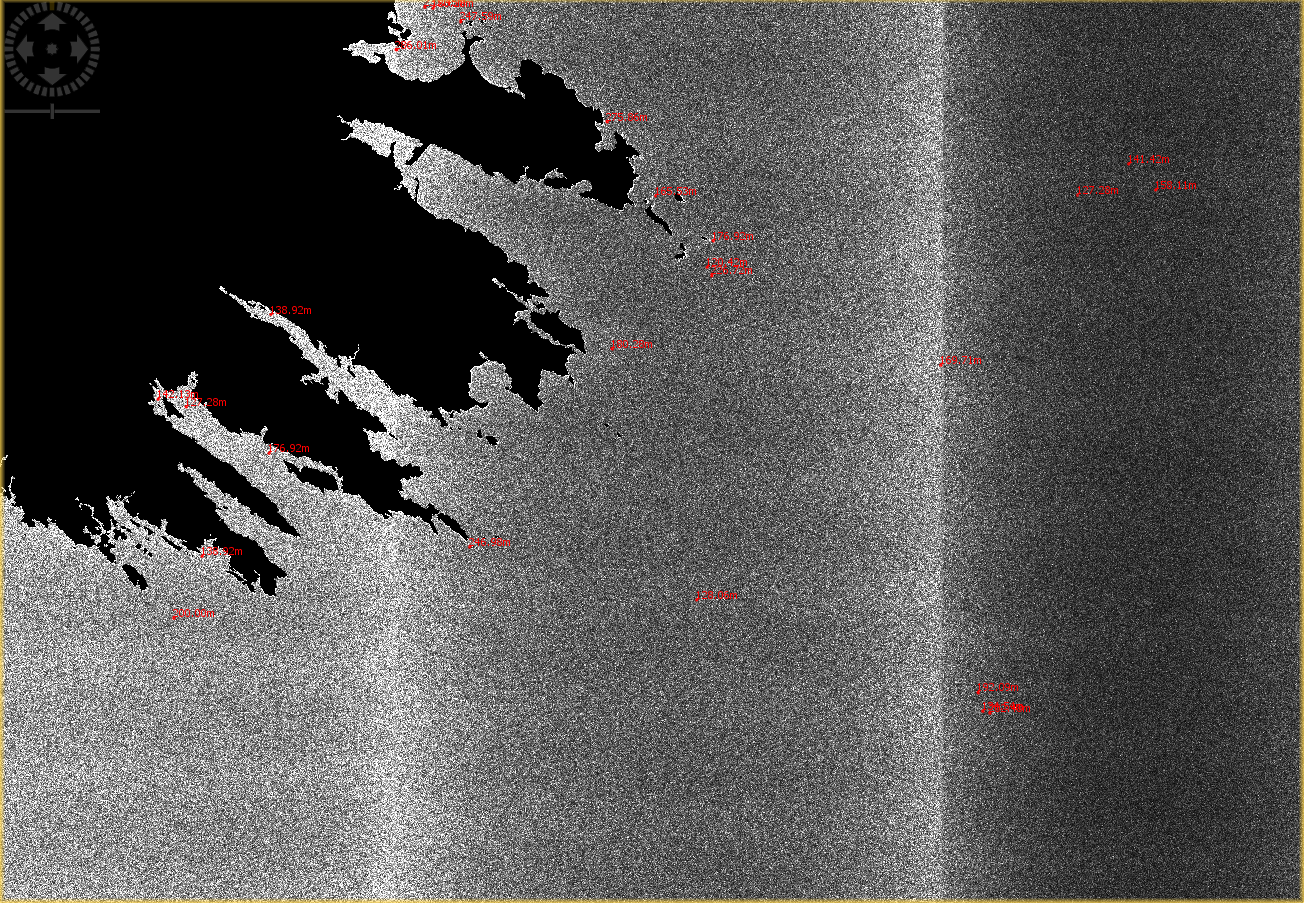
The end result in the SNAP toolbox was as follows:
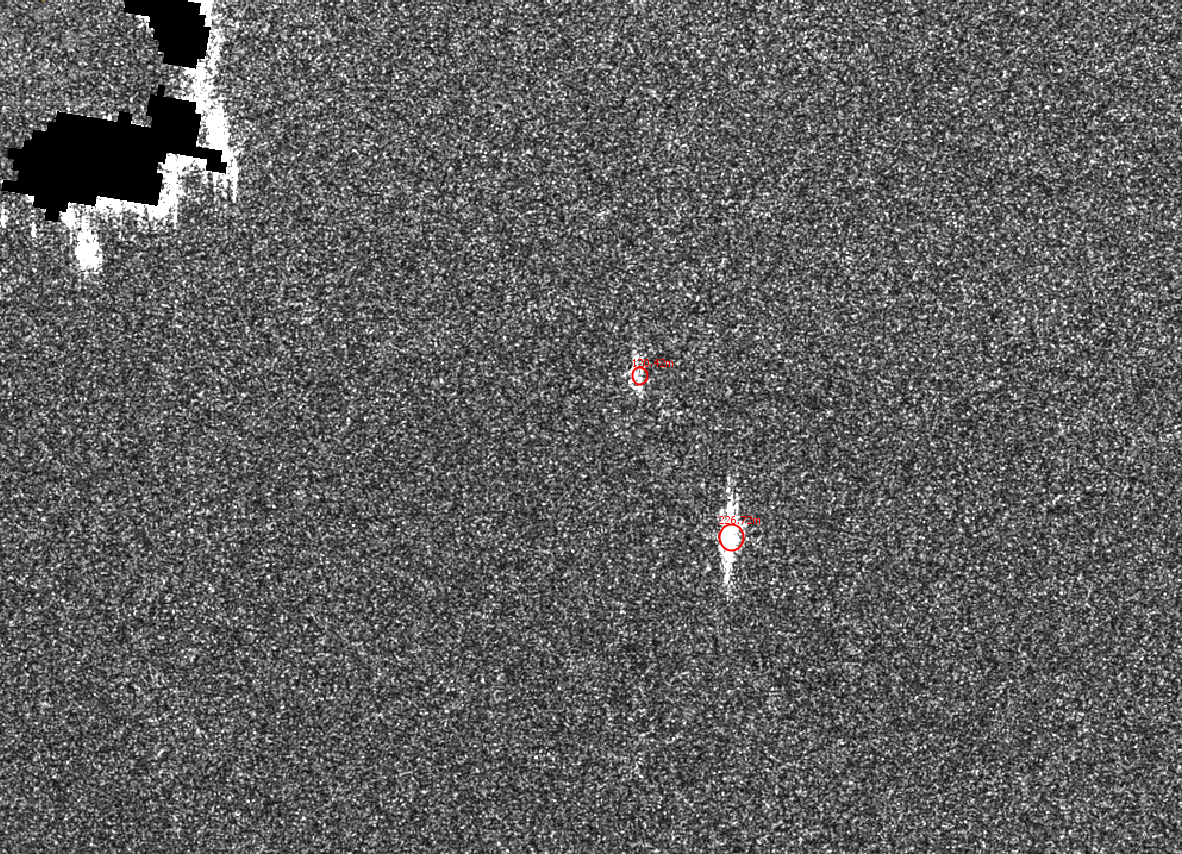
Individual Ships looks as follows:
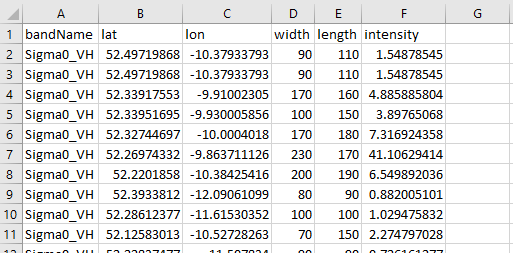
As Anne has desribed on her blog, the next step was to located the log file (xml file) and import it into Excel and save as a CSV as shown below.
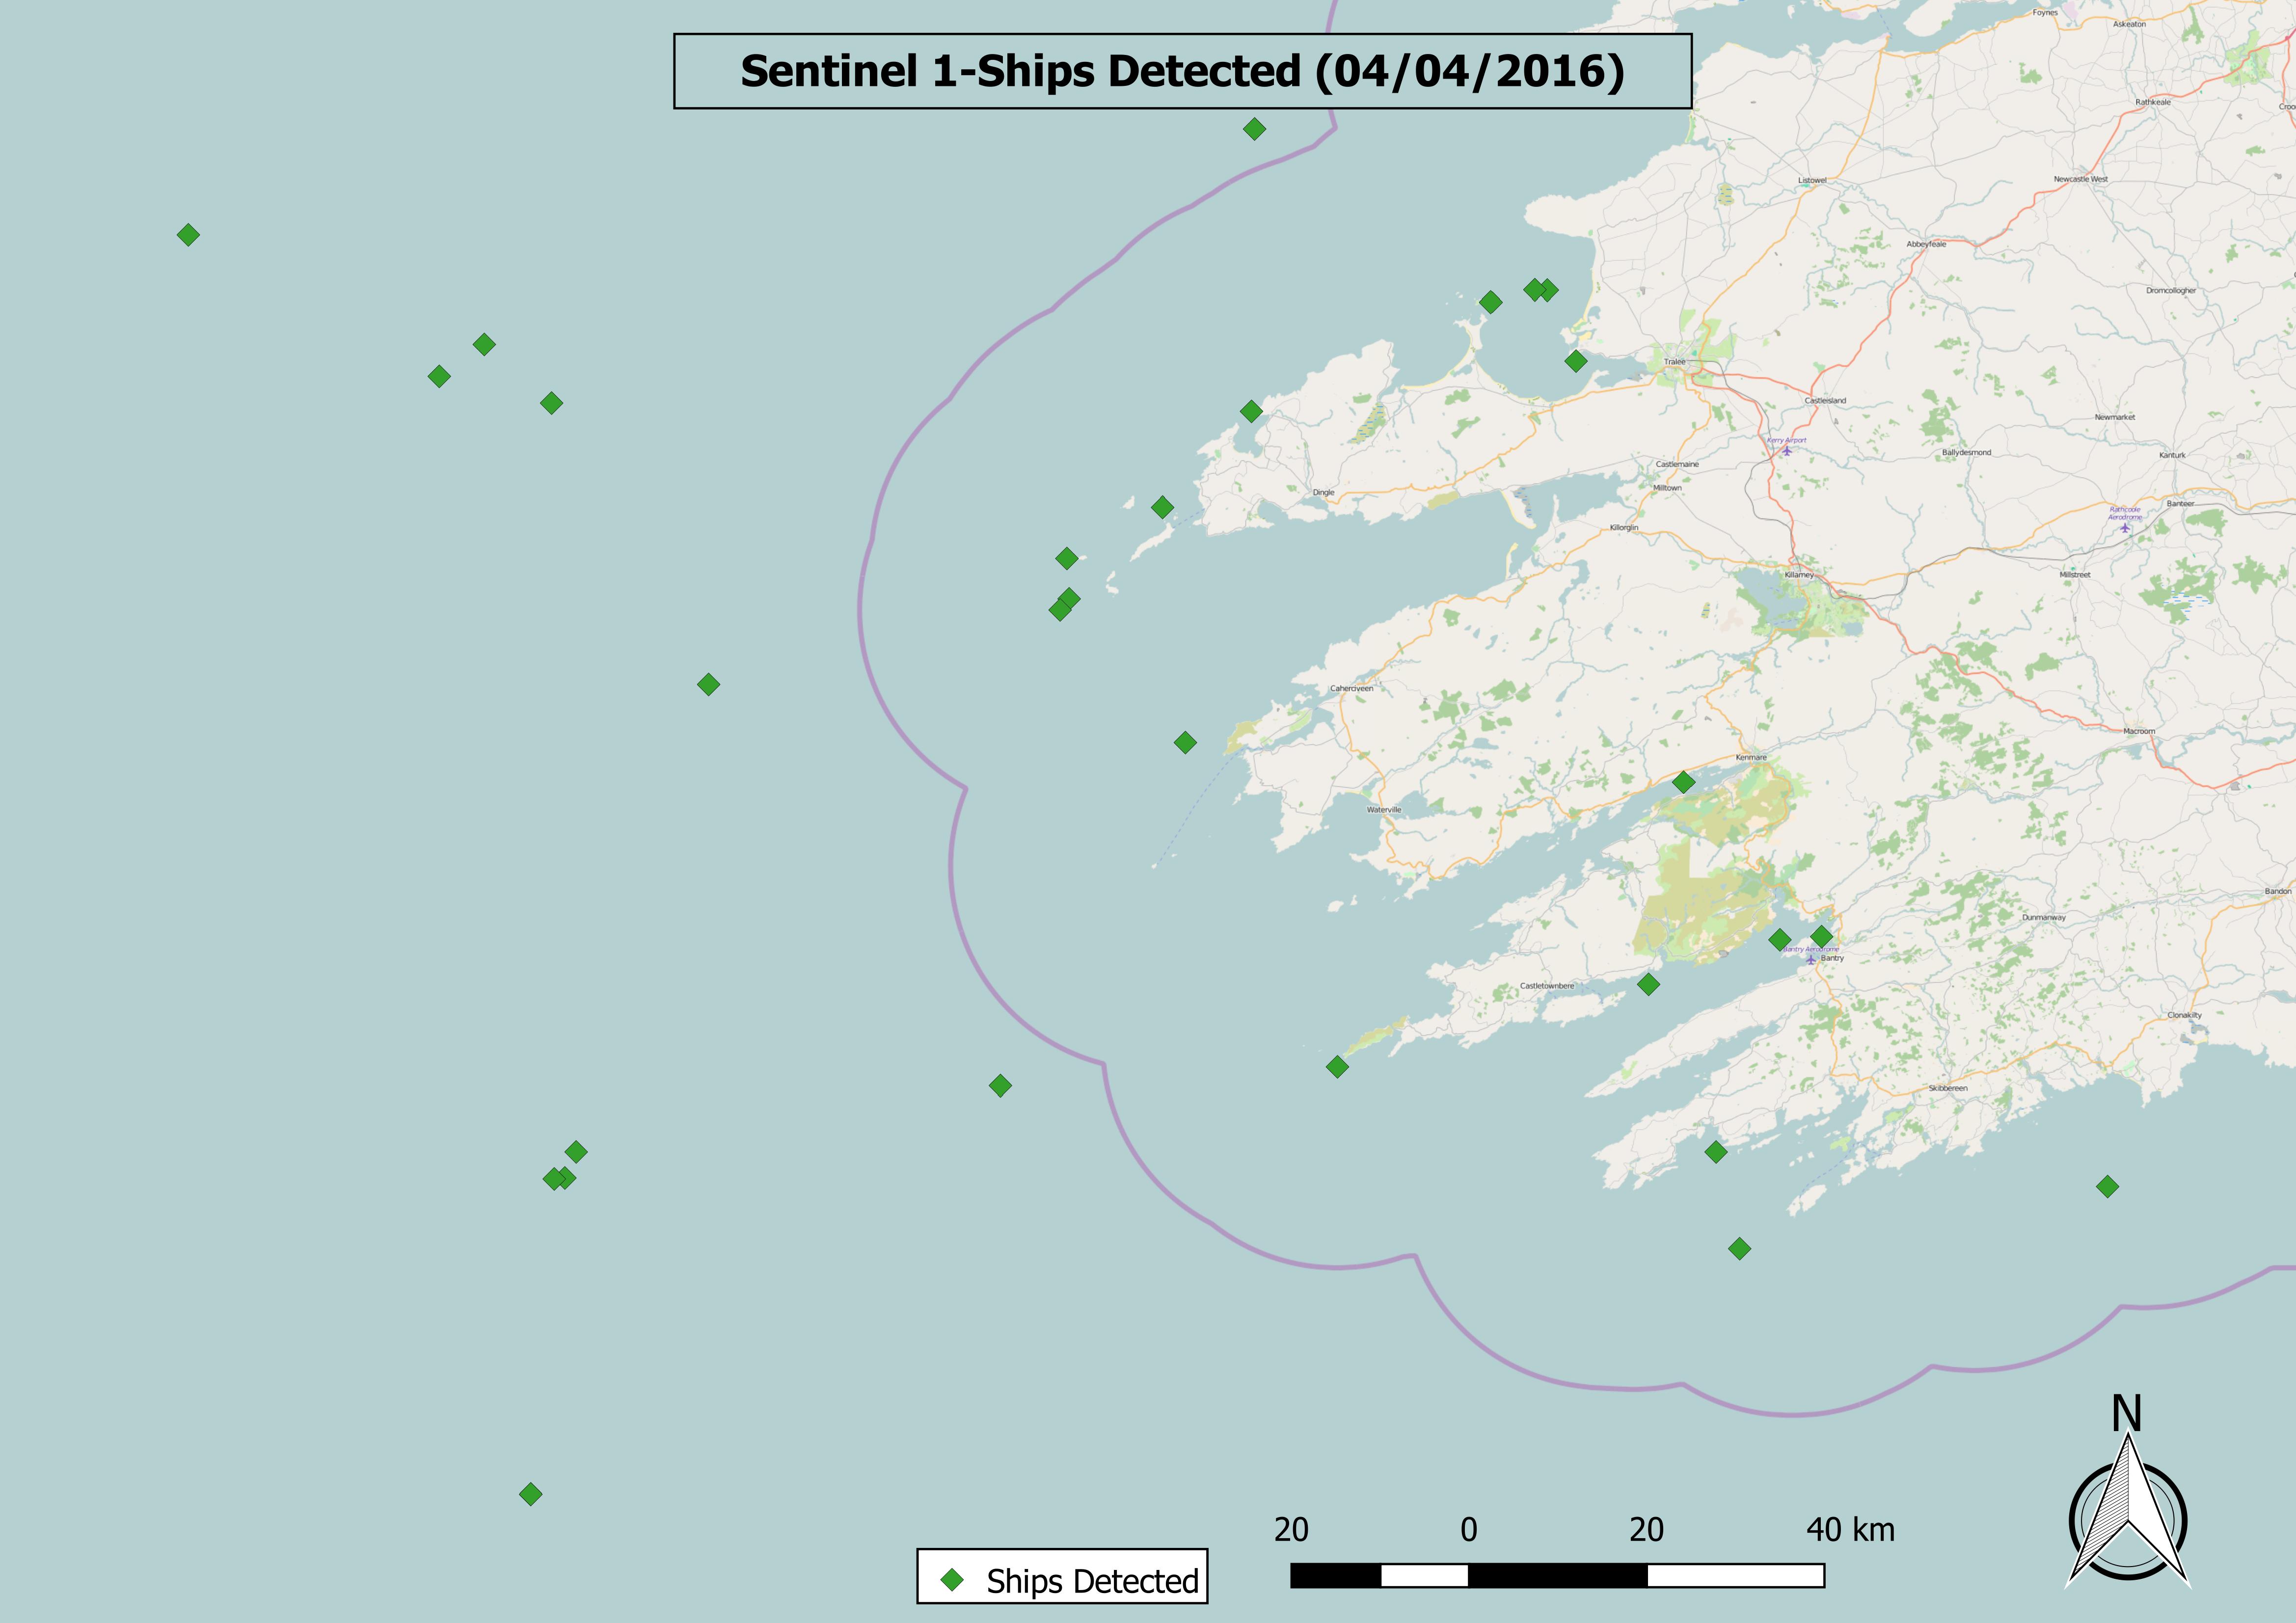
This was then imported into QGIS and a simple map was created with OSM as the background. The end result is shown below: