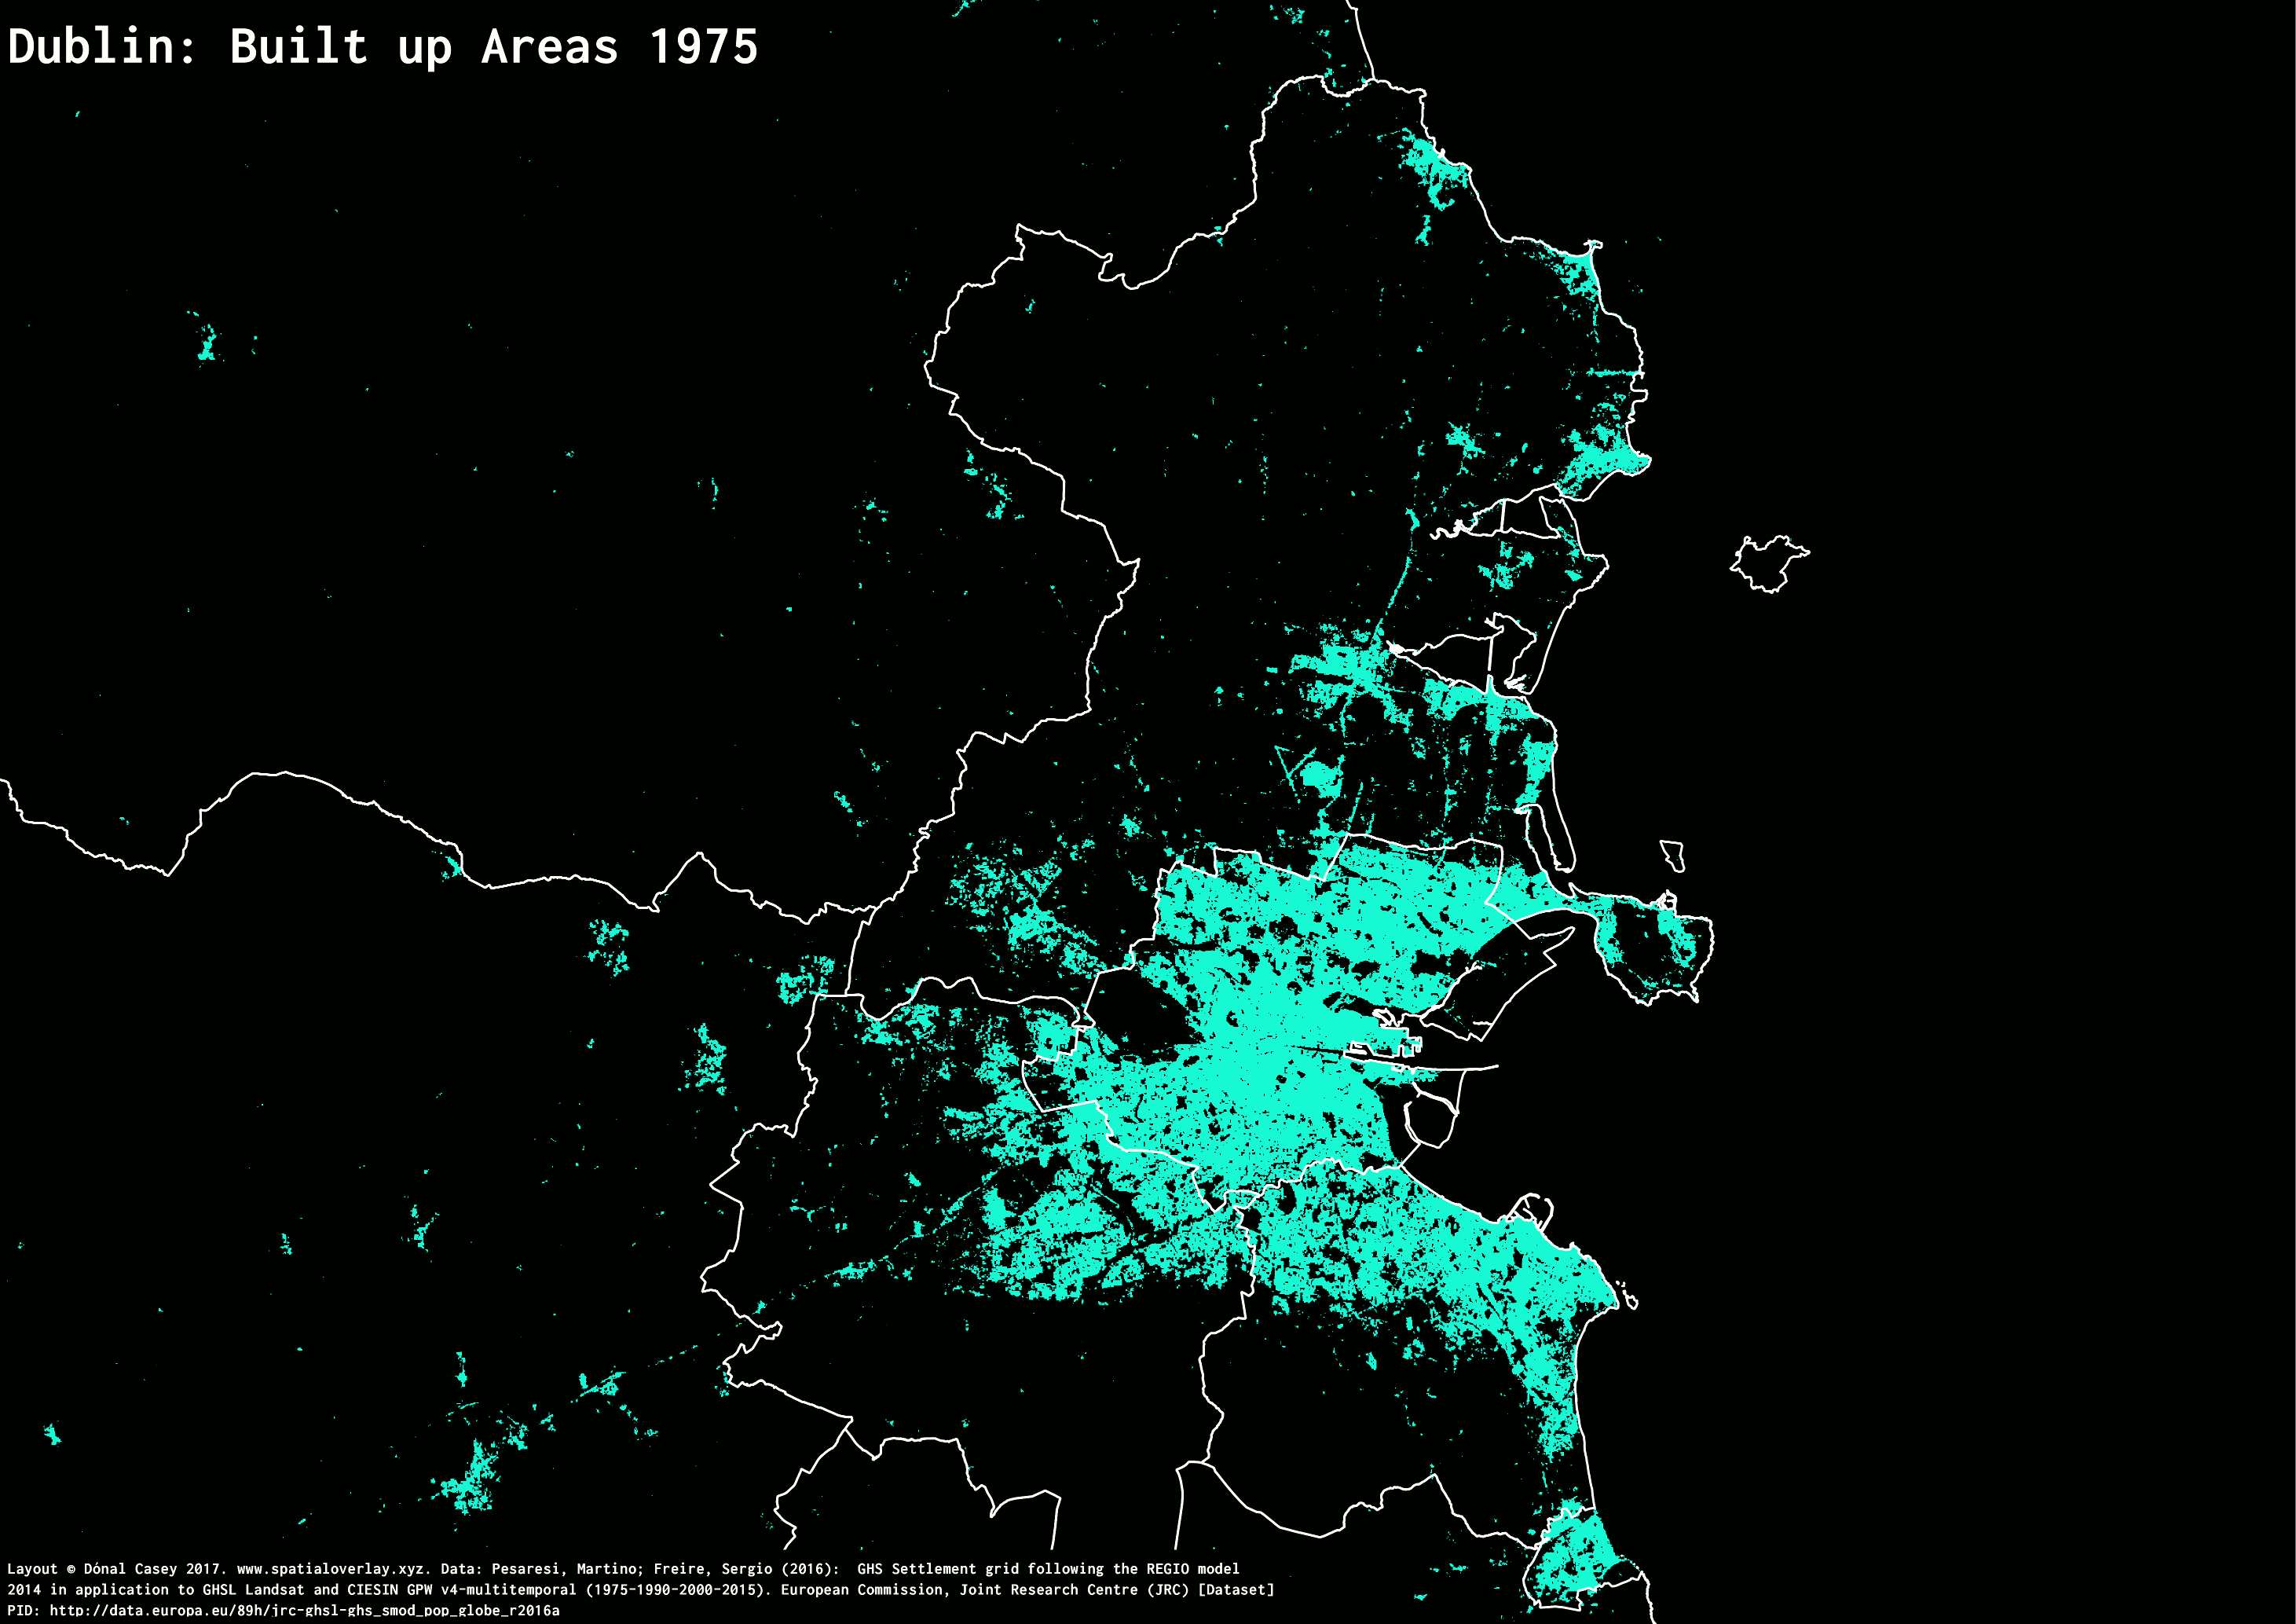
I’ve been taking a look recently at the Global Human Settlement Layer from the the European Commission. I’ve been working on a piece to do with the physical impact of the Celtic Tiger on Ireland, but in the meantime, I’ve put together a few fun GIFs using their built up data. This uses a combination of Landsat and Sentinel scenes for four epochs: 1975, 1990, 2000 and 2014. Below is a GIF showing the growth of Dublin during this time.