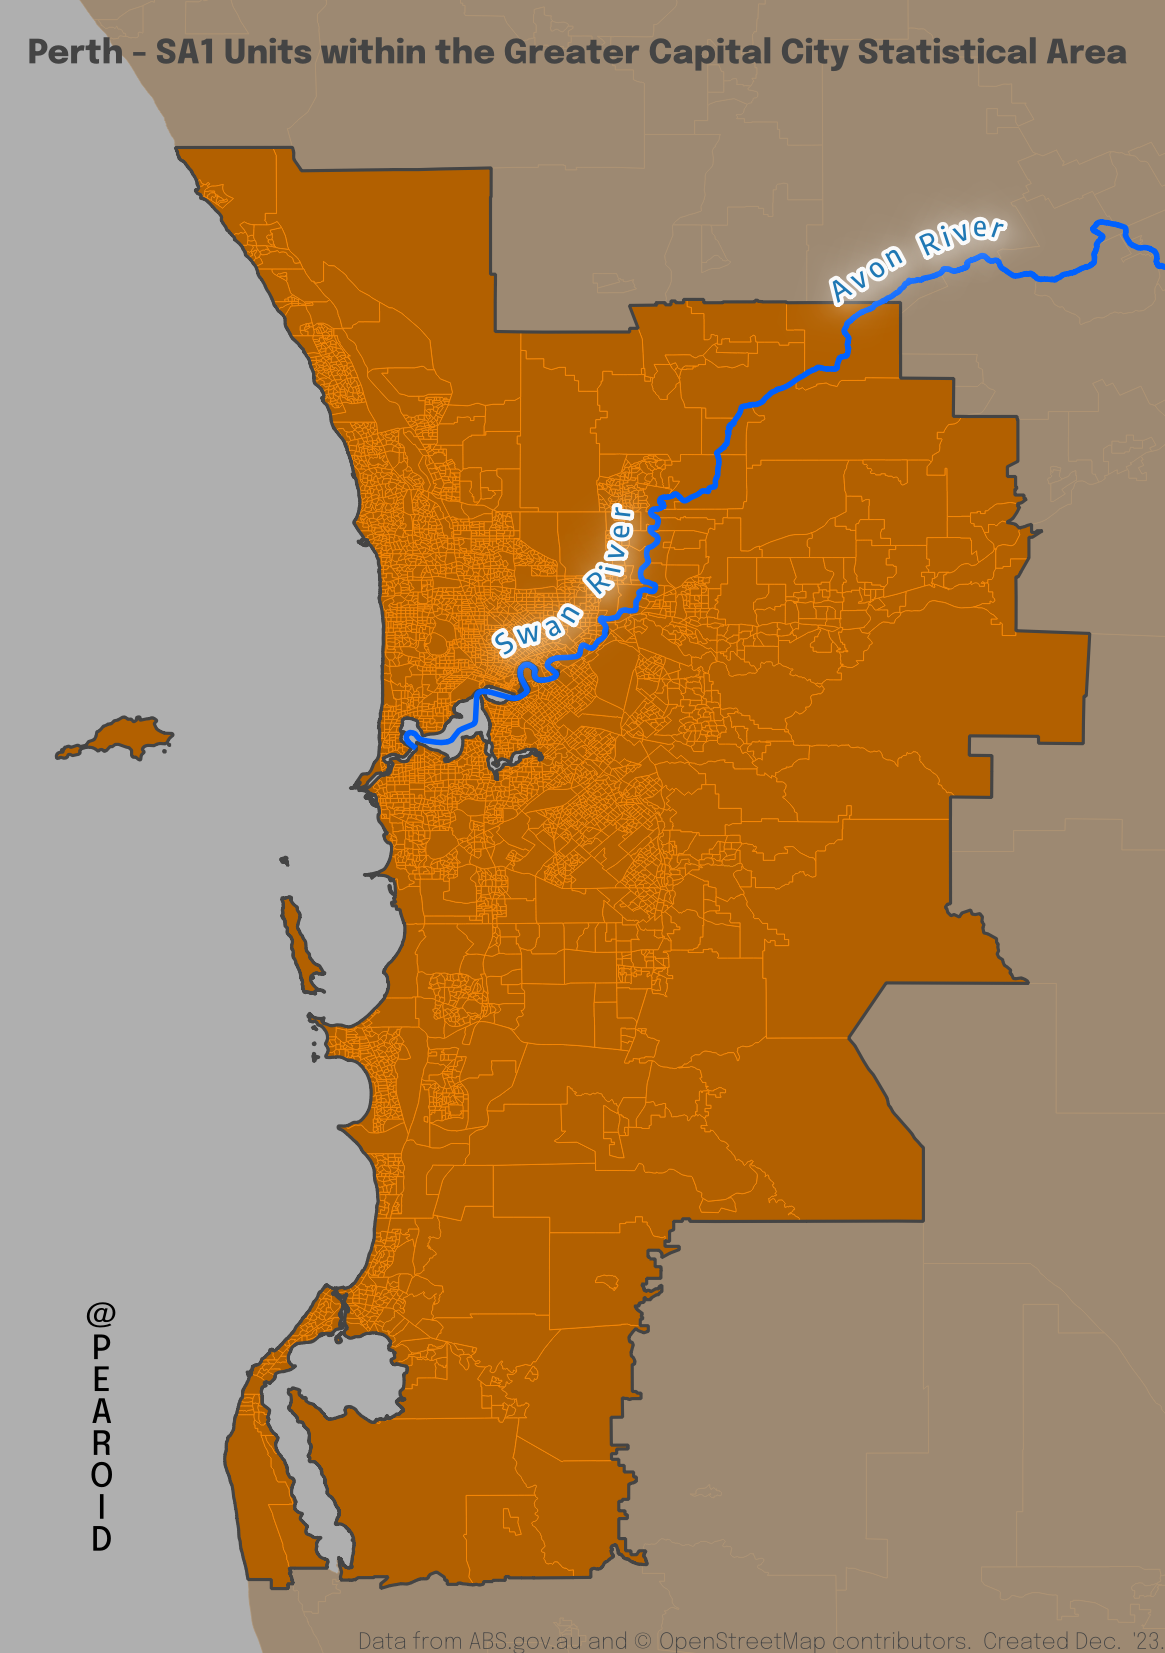
This post is in response to a chat I had a few days ago with someone who was wondering whether there are more people north or south of the river in Perth.
To answer this I’ve taken the ABS’ definition of Greater Perth (being the Greater Capital City Statistical Area [GCCSA]). The overall population of the Perth GCCSA is 2,116,647 (Census ’21). The greater city area is separated by both the Swan and Avon Rivers. I downloaded the polyline of the rivers from https://overpass-turbo.eu/ and then created polygons of both the north and south of the river to quickly select the SA1 areas within each. I then quickly ran a Select by Location to get the figures for the number of people that live north and south of the river.
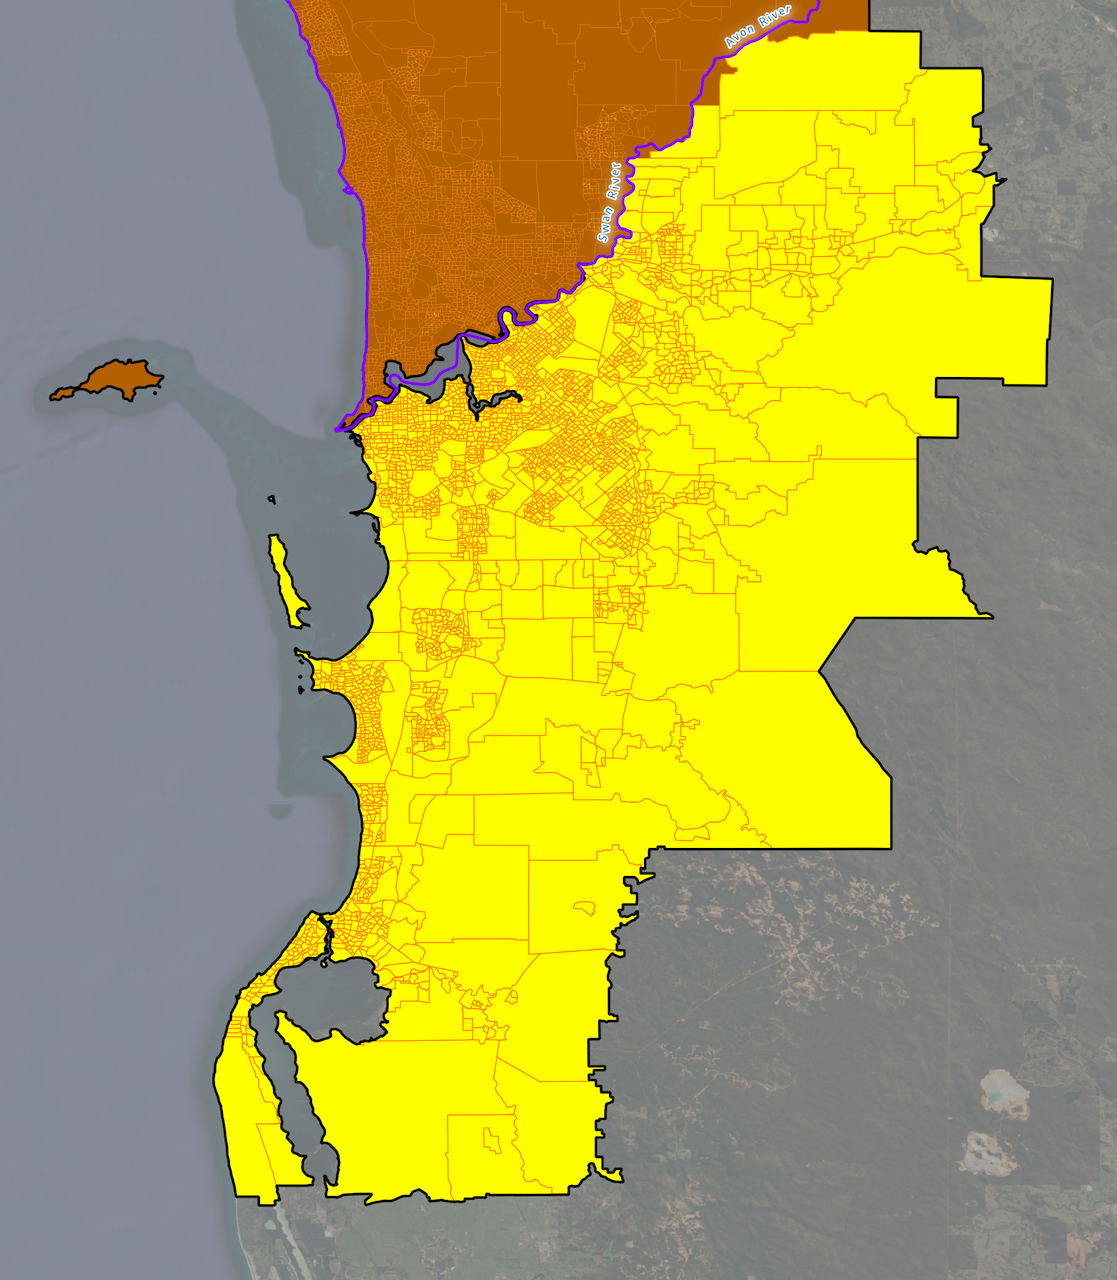
Once I had gotten the SA1 units north of the river it was simply a case of repeating the process for the SA1 areas south of the river.

The results are as follows:
North of the River –
Area = 1,653.8km² | Population = 962, 257 | Percentage of Perth GCCSA Population: 45% | Population Density = 581.9 Persons/km²
South of the River –
Area = 4,762km² | Population = 1,153,941 | Percentage of Perth GCCSA Population: 55% | Population Density = 242.2 Persons/km²
The above data is out to the tune of 179 people due to what I presume is data suppression in the very sparsely populated SA1 areas by the ABS. An interesting takeaway is that the population density south of the river is only 41.6% that of what’s north of the river.
Put another way, if the southern part of the City had the same density as the north, then there would be 2.784 million people south of the river—really puts it in perspective.