This week I was trying to recreate Joshua Steven’s Commanding Cartography. He presented this at NACIS 2018 and I was keen to give it a go. As I use Windows 10, the first step for me was to install Windows Subsystem for Linux and then install GDAL. I then used Wget to download the month of April from the United States’ National Oceanic and Atmospheric Administration’s Coral Reef Watch as NetCDF4 files. Earlier in the week I ran through his presentation again to see if I encountered any problems trying to run through the steps on a single NetCDF4 file. The steps were as follows:
- Convert the NetCDF4 files to tifs.
- Crop the tifs to the area of interest (North Atlantic Ocean).
- Reproject to Albers Equal Area.
- Apply a colour palette to the image.
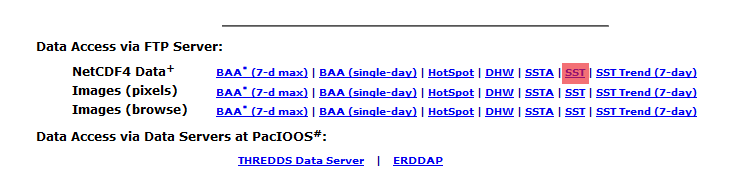
The only problems I encountered was trying to find the same data that Joshua used, and getting the projection type right for GDAL. I think I found the right download source by going to the daily NetCDF4 data (as below) and downloading the ‘SST’ data.
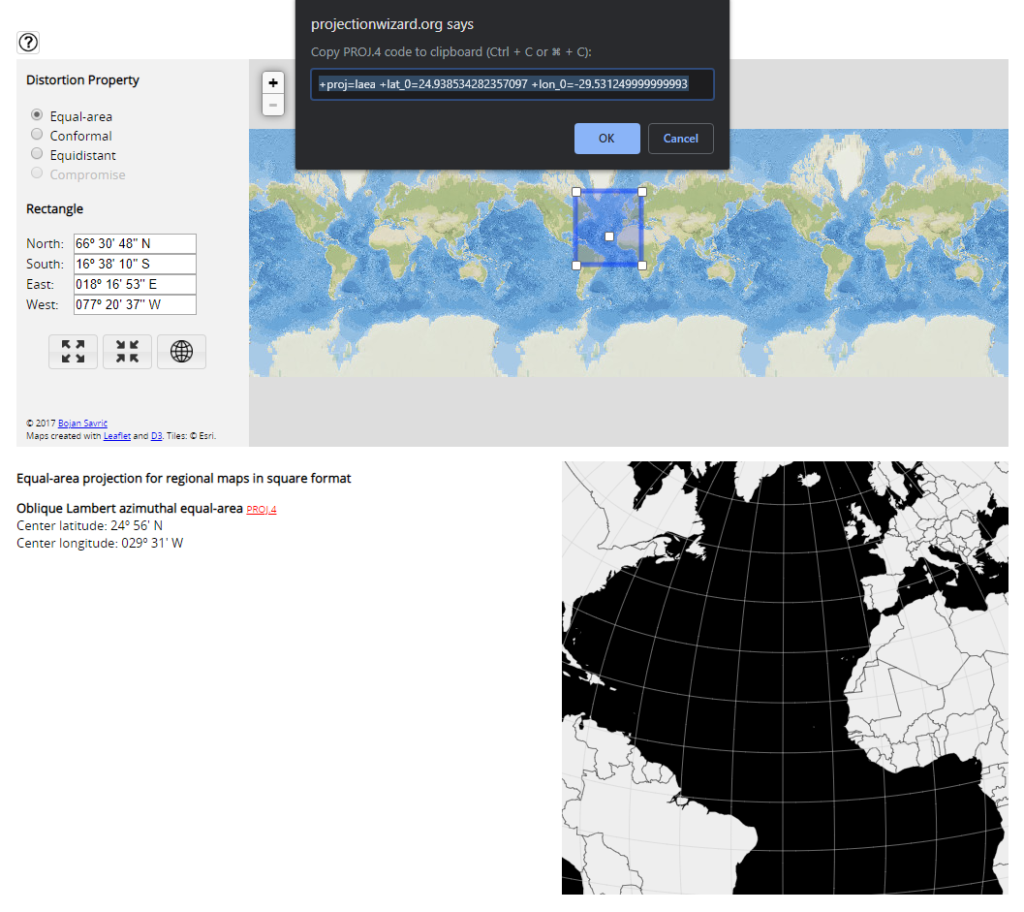
After some research, trial and error I reprojected the data to the Albers Equal Area projection with help from the brilliant Projection Wizard website. I selected the area of interest and copied the relevant proj4 string.
I created the first image of the sea surface temperature for April and posted it on Twitter during the week:
Next, I wanted to create a GIF for the entire month of April. I followed Joshua’s presentation again, and used a series of bash for-loops. Following his example I used ImageMagick through the command line to resize my final tifs, convert and resize them, and then create the GIF. This is shown below along with my for-loop that worked to reproject all 30 daily temperature tifs to Albers.
My planned next step will be to use the gravity setting in ImageMagick to annotate each of the individual tifs with their date taken as a variable from the filename. This is so the GIF will show each date as it cycles through. I’m not 100% sure once I resize etc. whether this will actually work but I’m hoping to find out.
for f in *.tif; do
	gdalwarp -t_srs "+proj=aea +lat_1=5.101266605156489 +lat_2=56.35029964751531 +lon_0=-28.125" $f  "${f%.*}_Projected.tif"
done